This is Post title
December 25, 2017
1. Idea
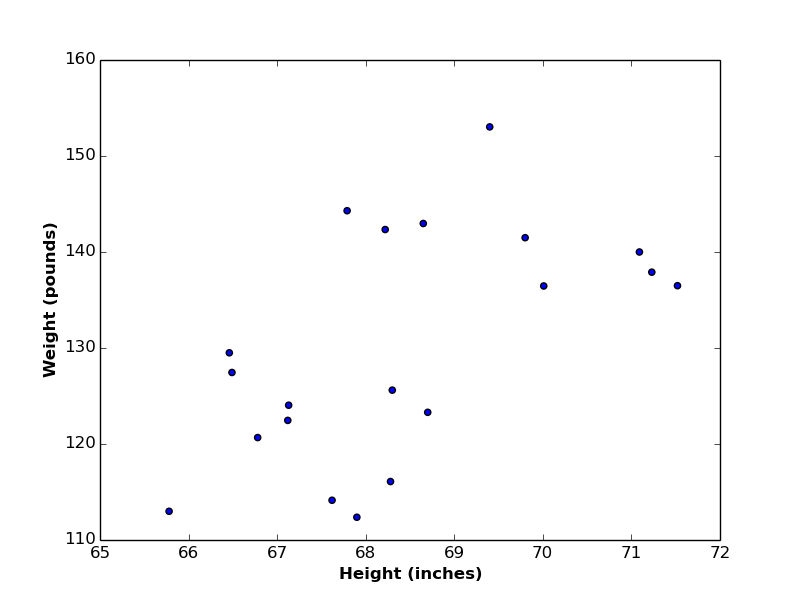
Suppose we have a set of observations represented by two dimensions \(x\) and \(y\). Let’s assume that our observations are group of people, and the \(2\) dimensions are their heights (\(x\) axis) and weights (\(y\) axis). In this data, we can easily find a kind of correlation between heights and weights (i.e. as height increase, weight increase as well, and vice versa)

Let’s also assume that we want to find a linear relationship (i.e. linear function) between heights and weights, such that if we have the value of a new person (say height), we can predict her/his corresponding weight value. In this case, we call variable height the independent variable or predictor, and variable weight the dependent variable or target variable.

As a reminder, the linear function is defined by \(2\) coefficients (\(m\) is the slope, which reflects the change in \(y\) divided by the change of \(x\)), and \(b\) (which is the point at which the line intersects with \(y\) axis). In below figure, \(m = 4.13\) and \(b = -152.43\)

Back to our goal, we need to find a linear function between \(x\) and \(y\), but, which linear function? As you can imagine, there are endless number of lines that can represent such function. So the question would be, which line is the best?

Let’s go to the theory of linear regression, to be able to answer this question.
2. Theory
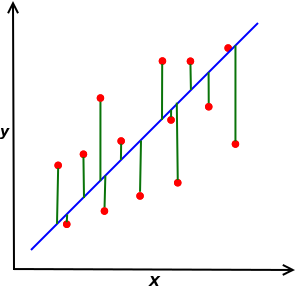
If we have a set of observations like the figure below, the best line between variables \(x\) and \(y\) would be the one that minimizes the distances between the true values and it’s corresponded predicted values (this approach is called the Least Squares approach, since we minimize the square of the errors.


The mathematical formulation of the above goal is to find a vector of coefficients \(\vec{w}\) that minimizes the following Error function:
\begin{equation} E(\mathbf{w}) = \frac{1}{N}\sum \limits_{i=1}^N [y^{(i)}-f(x^{(i)},\mathbf{w})]^2 \tag{1}\end{equation}
Notations:
- \(x^{(i)}\) is the value of variable \(x\) at observation \(i\)
- \(N\) is number of observations
- \(\mathbf{w}\) is vector of coefficients to identify linear regression function

